At this stage of the process, it is already possible to make a preliminary
statistical analysis of the observing run without having to inspect
the files individually. One can, for instance, plot the r.m.s noise
of the flat field exposures against their mean pixel value to check
the general consistency of the frames. Or one may want to plot
the mean temperature of the detector against the date of the exposures
to check whether there are outliers.( Figure ![]() )
)
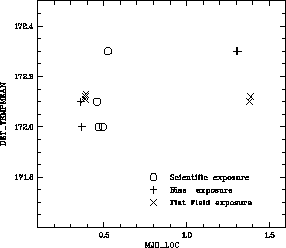
Figure: Trend analysis of the detector mean temperature with Modified Julian Date